The continuous pursuit of excellence in processes and end products is integral in every business sector. Key to this pursuit is the utilization of various tools and strategies to aid in quality control. Among these tools is the Pareto Chart, which, when used effectively, can significantly facilitate the process of rooting out and addressing defects. In this article, we delve into the essential nature, applications, and benefits of the Pareto Chart in quality control.
In this article, we delve into the essential nature, applications, and benefits of the Pareto Chart in quality control.
Understanding Pareto Charts
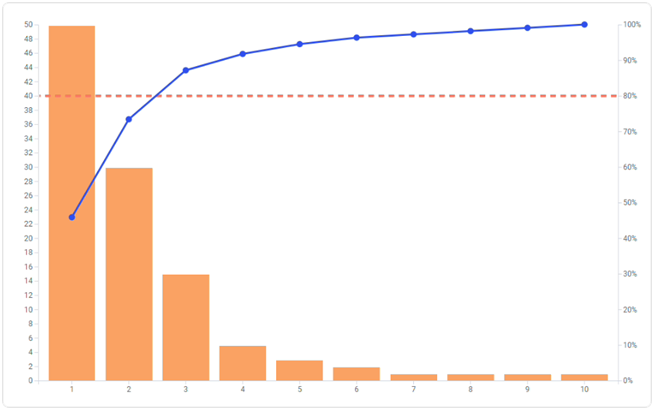
Named after an Italian economist, Vilfredo Pareto, Pareto Charts are a kind of bar graph used in quality control to identify the different causes of defects and determine the ones significantly impacting the quality. It combines a bar graph, where each bar represents an attribute or quality problem, and a line graph, which cumulatively sums up the frequencies.
The Pareto Chart functions based on the Pareto Principle, or the '80/20 Rule', which posits that approximately 80% of consequences come from 20% of the causes.
The chart's value lies in its ability to clearly display where to focus efforts for significant quality improvement. With the effective application of Pareto charts, organizations can identify major problem areas and subsequently allocate resources in a targeted and efficient manner. Thus, Pareto Charts serve as a direct, lucid, and powerful data visualization tool in quality control protocols.
Decoding The 80/20 Rule in Pareto Charts
As discussed, the Pareto Principle asserts that the majority outcomes are often determined by a minority of causes. In business operations, this concept translates to the idea that 80% of a company’s problems are likely due to the top 20% of causes.
Pareto Charts display data in such a way that highlights this principle, helping businesses quickly identify the most important factors influencing their operational outcomes. Recognition of these significant factors enables organizations to tackle problems systematically and in a way that can yield the most substantial improvements.
By decoding the 80/20 rule in their processes with Pareto Charts, organizations can streamline their operations, improve quality, and optimize resource allocation.
It is imperative to understand, however, that the 80/20 rule is a principle, not a rigid law, that applies to all circumstances.
Applying Pareto Charts for Root Cause Analysis
In quality control, Pareto Charts are majorly used for root cause analysis, which involves determining the origins of problems to prevent their recurrence. In a manufacturing firm, for instance, a Pareto Chart can help identify the type of defects occurring most frequently in a product line.
The chart guides teams in investigating these frequent issues first and determining their root causes. By doing so, teams can minimize these common issues and drastically improve the overall quality of their products.
Beyond manufacturing, Pareto Charts also feature use cases in various sectors, including hospitality, retail, healthcare, and service industries, where they help drive improvements in services and customer satisfaction.
From reducing project delays to optimizing services, Pareto Charts, with their focus on root cause analysis, can bring significant improvements in diverse business scenarios.
Leveraging Pareto Charts to Improve Quality Management System
Integration of Pareto Charts into a company's Quality Management System (QMS) can result in enhanced visibility of quality issues and improved problem-solving capabilities. Their graphical representation makes it easier to interpret and understand data, thus enabling informed decision-making and strategic planning.
Pareto Analysis can aid in optimizing the QMS by identifying improvement opportunities and highlighting areas that require training. This will, in turn, lead to enhanced quality control, reduced reworks, greater cost savings, and overall improved operational efficiency.
The accessibility of modern software tools allows for easy creation, customization, and sharing of Pareto Charts. This ease of utilization makes embedding Pareto Chart analyses into the QMS an effortless and effective strategy for continuous improvement.
As demonstrated, leveraging the efficacy of Pareto Charts could greatly enhance a business's quality control process and enhance data-informed decision-making.
Altogether, the utility of a Pareto Chart cannot be overstated. It provides a solid means to visualize and tackle significant quality control issues head-on, paving the way toward continuous improvement and excellence in organizational operations.

